
Figure 4.
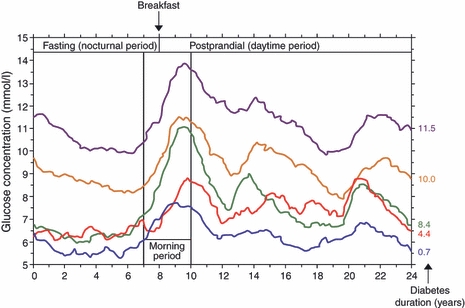
The 24-h recordings from a continuous glucose monitoring system in five groups of patients with type 2 diabetes. Blue: HbA1C < 6.5%; red: ≥ 6.5% to < 7%; green: ≥ 7% to < 8%; orange: ≥ 8% to < 9%; purple: ≥ 9%. Reproduced with permission from Monnier L et al. Diabetes Care 2007;30:263–9