
Figure 2. Exacerbated LV chamber dysfunction and dilation in me-TG and hi-TG mice subjected to 6-wk TAC.
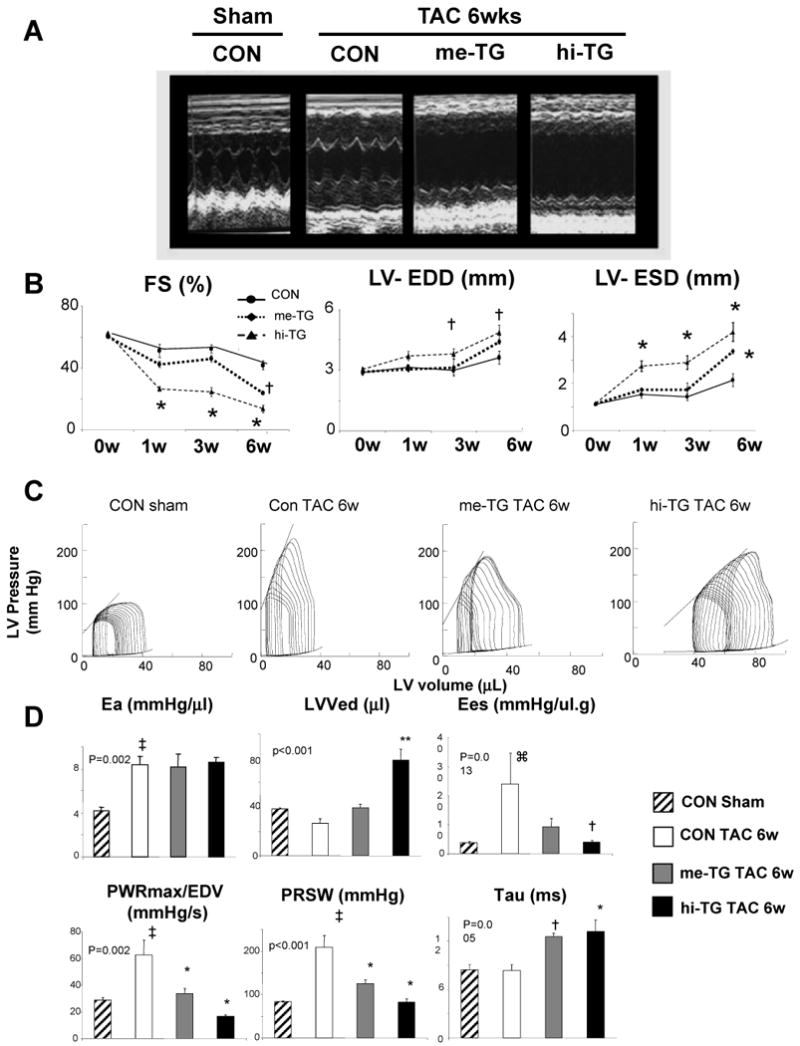
A) Representative echocardiograms and B) Summary data for fractional shortening (FS%), left ventricular end-diastolic and end-systolic dimension (LV-EDD, LV-ESD). (n=3-5/ group; 2-way ANOVA p<0.05 for interaction of group*time for each; † p<0.05 versus CON-TAC-6wk; * p<0.01 versus CON-TAC-6w. C) Representative left-ventricular pressure-volume loops and relations show a right shift and contractile depression, particularly in hi-TG mice vs controls. Slope of the end-systolic PV (left upper line) relationship (Ees) reflects contractile function. D) Summary data from PV loop analysis. Effective arterial elastance (LV afterload, Ea) increased similarly in all groups. LVEDV- LV end-diastolic volume, Tau – time constant of relaxation, Ees, - end-systolic elastance, PWRmax/EDV – maximal LV power divided by EDV, and PRSW, preload recruitable stroke work. The latter three are indexes of contractile function. (n=3∼4 per group; p-value for 1-way ANOVA shown for each. ⌘ p<0.05 versus control sham, Kruskal-Wallis test, ‡ p<0.01 versus control sham, † p<0.05 versus control TAC 6w, * p<0.01 versus control TAC 6w, **p<0.001 versus control TAC 6w.