
Figure 4. Effect of PDE5 upregulation on TAC-stimulated PKG activity, calcineurin, and calcium cycling proteins.
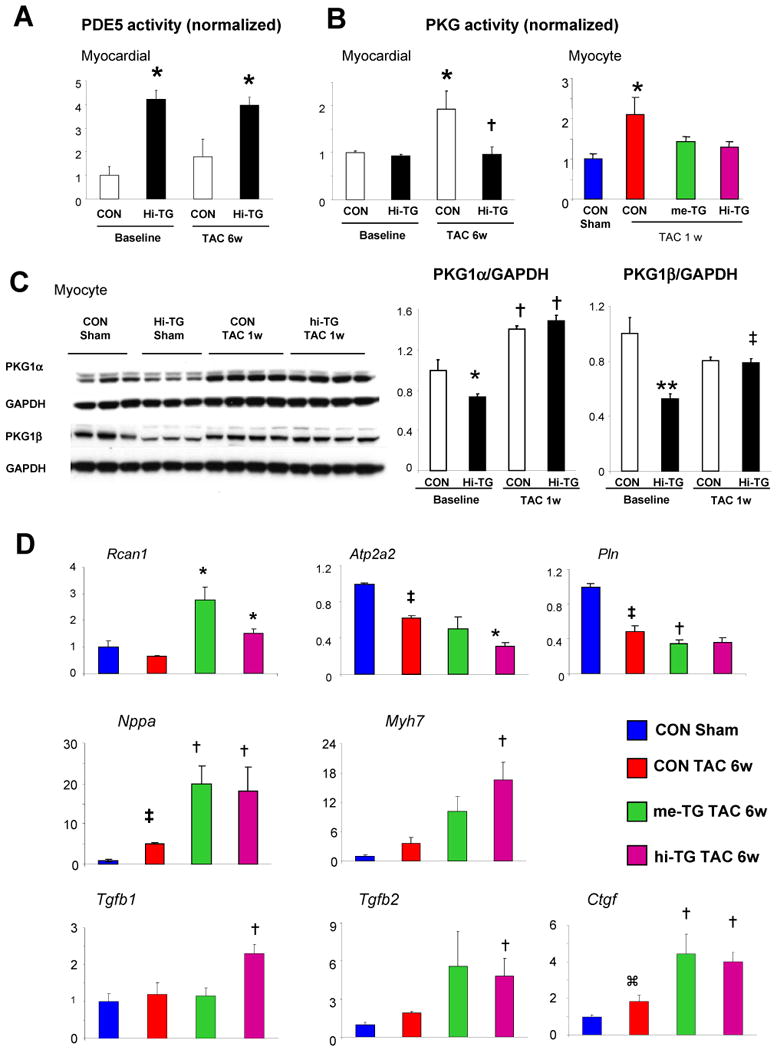
A) Myocardial PDE5 activity in CON versus hi-TG mice before and after TAC (* p<0.01 versus CON, same condition). B) Myocardial PKG activity in CON versus hi-TG mice before and after 6-wk TAC (*p<0.05 versus CON baseline, † p <0.05 versus CON-TAC 6w), Right: isolated myocyte PKG activity determined after 1-wk TAC (* p<0.01 versus CON, n=3-5 in each group. C) PKG1α and PKG1β protein expression at baseline and after TAC in CON and hi-TG mice. (2W-ANOVA,* p<0.05 vs CON baseline, ** P<0.005 vs CON baseline, ‡ p<0.05 vs hi-TG baseline, †p<0.001 vs same group baseline). D) Gene expression assessed by quantitative rtPCR for regulator of calcineurin (Rcan1), SERCA2A (Atp2a2), phospholamban (Pln), A-type natriuretic peptide (Nppa), β-myosin heavy chain (Myh7), tissue growth factor β1 and β2 (Tgfb1, Tgfb2), and connective tissue growth factor (Ctgf) – each normalized to Gapdh. ⌘ p<0.05 versus control sham, ‡ p<0.01 versus control sham, * p<0.01 versus control TAC 6w, † p<0.05 versus control TAC 6w (n=3-6 in each group).