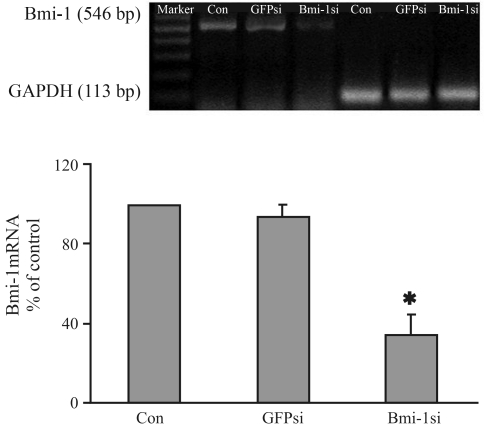
Figure 1.
RT-PCR analysis of Bmi-1 mRNA level of MCF-7 cells 48 h after transfection. The ratio of band density for Bmi-1 to GAPDH in Bmi-1si was significantly lower, showing a 67% reduction in density as compared to the blank control; in GFPsi, the ratio showed a 5.2% reduction compared to the blank control. There were significant differences between Bmi-1si and controls (p < 0.05). Bar graphs represent the results of the densitometry analysis of Bmi-1, expressed as a percentage of the ratio (molecule of interest/GAPDH mRNA) detected in the control (*p < 0.05 vs. control).

