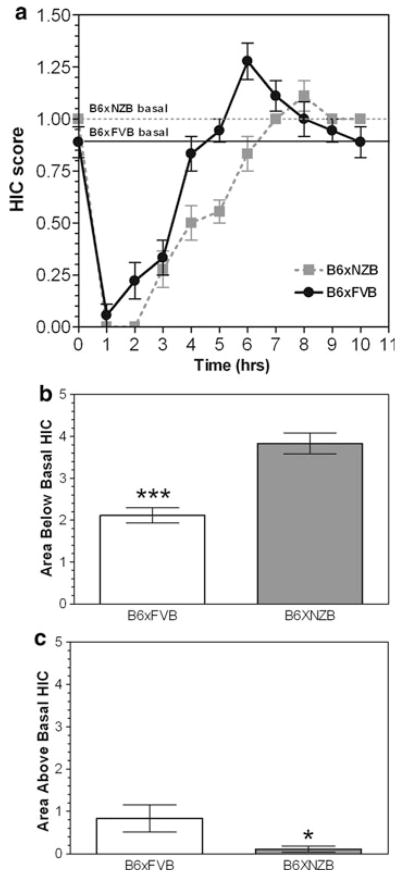
Fig. 4.
Low severity of acute ethanol-induced withdrawal in B6 × NZB and B6 × FVB mice. a. Handling induced convulsion (HIC) scores after a single injection of ethanol (4 g/kg). Dashed horizontal line denotes B6 × NZB baseline HIC level and solid horizontal line denotes baseline HIC level for B6 × FVB. b Area under HIC curve and below the basal HIC level is higher for B6 × NZB mice than for B6 × FVB mice. *** p<0.001. c Area under HIC curve and above the basal HIC level is higher for B6 × FVB mice than for B6 × NZB mice. * p<0.05

