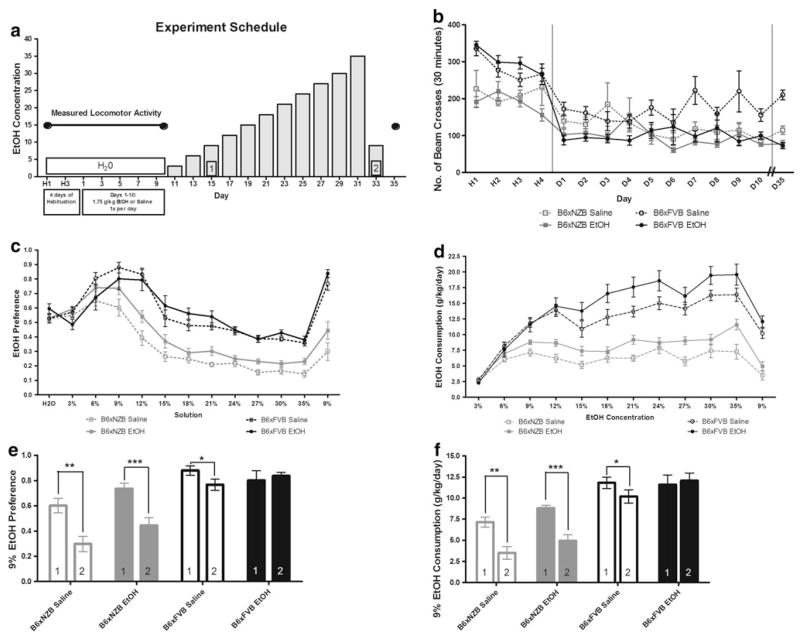
Fig. 5.
Ethanol injections with measured locomotor activity followed by ethanol self-administration. a Diagram of experimental schedule. b Locomotor activity reported as total number of beam crosses during 30 min session. Day of measurement is reported on the x-axis (H1–H4 represents habituation days 1–4, D1–D10 represents ethanol or saline injection days 1–10, and D35 represents ethanol injection after completion of the ethanol preference test. Vertical lines are plotted to aid in visualizing the data according to the experimental schedule. c Voluntary ethanol consumption presented as g/kg/day. d Preference for solution in two-bottle choice beginning with data from two-bottle, water only (H2O), immediately followed by data from two-bottle, water and ethanol solution (%). e Comparison of first and second presentation of 9% ethanol consumption. f Comparison of first and second presentation of 9% ethanol preference. * p<0.05, ** p<0.01, *** p<0.001

