Figure 3.
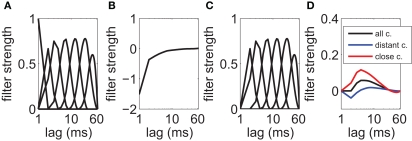
Coupling filters in the generalized linear model. (A) Spline basis functions that are used for the spike-history kernel. Note the logarithmic scale on the x-axis. (B) Mean filter that was obtained for the self-history dependencies (auto-regressive component) after fitting. A refractory period with a time constant of around 10 ms is visible. (C) Spline basis functions that are used for the cross-history kernels. (D) The mean filter for cross-dependencies fitted from the data shows a slight excitatory impact from other neurons (black line). The average over pairs of neurons at the same electrode (red line) shows that most close couplings are effectively excitatory. The mean coupling between distant pairs (blue line) shows a biphasic response in time.

