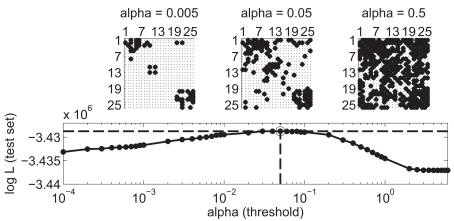
Figure 5.
Choice of threshold for binary connectivity matrix. The model is fitted on 80% of the data set (training set). Reduced models are created by applying a threshold a on the significance value of estimated coefficients for the cross-coupling terms. The performance of the models is evaluated on the 20% remaining data (test set). Performance is measured with the log-likelihood of the data (larger value indicates a better model). A broad regime from 0.02 ≤ α ≤ 0.08 of optimal threshold is visible. In the study, α was set to 0.05 (circle and dashed lines). The choice of threshold directly influences the edge density of the reconstructed graph. Examples of connectivity matrices are shown for different choices of threshold (α = 0.005, 0.05, and 0.5). A non-zero entry at row i and column j indicates a directed link from neuron i to neuron j. Neurons are sorted according to the electrode from which they were recorded from.

