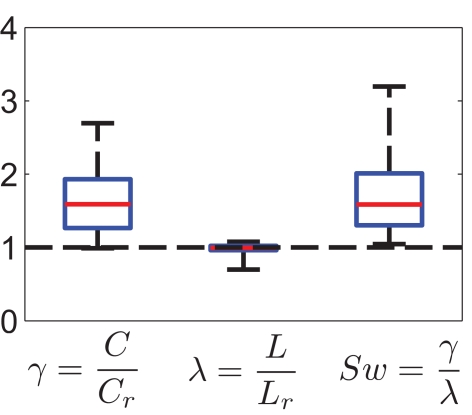
Figure 7.
Summary statistics of small-world property (N = 17 networks). The left box plot represents the distribution of γ = C/Crand, the middle box plot shows λ = L/Lrand, and the small-world-ness measure Sw = γ/λ is shown on the right plot. All Sw were larger than 1. The baseline for random networks corresponds to the dashed line. Red line denotes median, boxes represent 25 and 75% quantiles. Whiskers extend to the extremal values.

