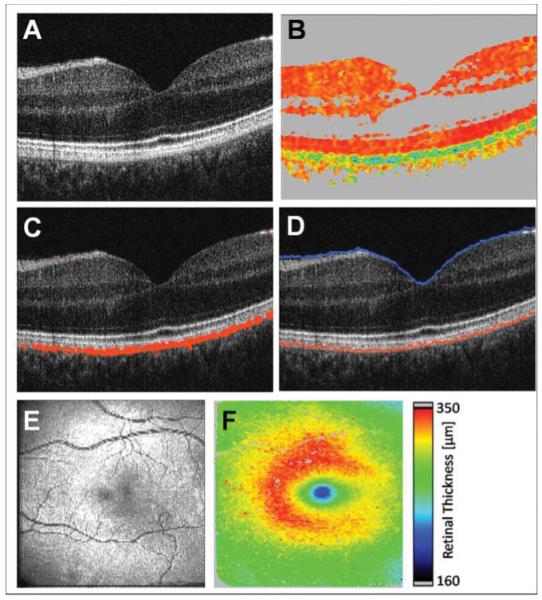
Fig. 2.

PS-OCT images. (a) Reflectivity B-scan image. (b) DOPU B-scan image [color scale: DOPU = 0 (dark blue) to DOPU = 1 (red)]. Pixels with intensities below a certain threshold are displayed in gray. (c) Overlay of depolarizing pixels on reflectivity image in red. (d) Position of ILM and RPE overlaid on reflectivity image in blue and red, respectively. (e) En face fundus image reconstructed from 3D OCT data set. (f) Retinal thickness map computed as geometric axial distance between ILM position and RPE position.
