
Fig. 3.
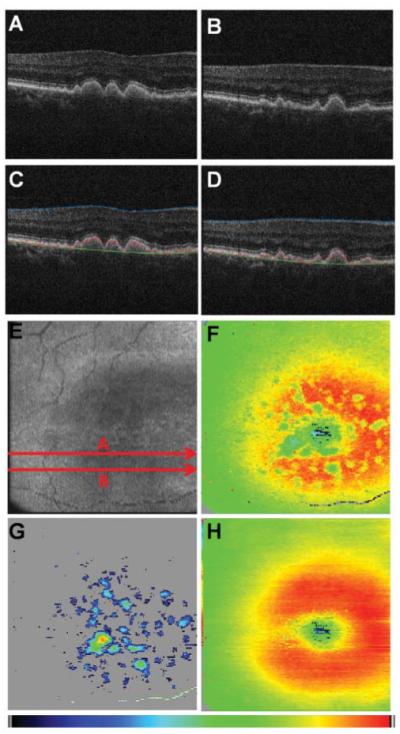
Results from drusen segmentation. (a, b) Reflectivity B-scan images. (c, d) Overlaid positions of ILM (blue), RPE (red), and normal RPE (green). (e) En face fundus image reconstructed from 3-D OCT data set. (f) Retinal thickness map showing the axial distance between ILM and RPE position (color map: 70–350 μm). (g) Drusen thickness map computed as axial distance between segmented RPE position and approximated normal RPE position. The color map was scaled to the maximum elevation value of 55 pixels corresponding to ~128 μm. (h) Retinal thickness map showing the axial distance between ILM and computed normal RPE position (color map: 70–350 μm).