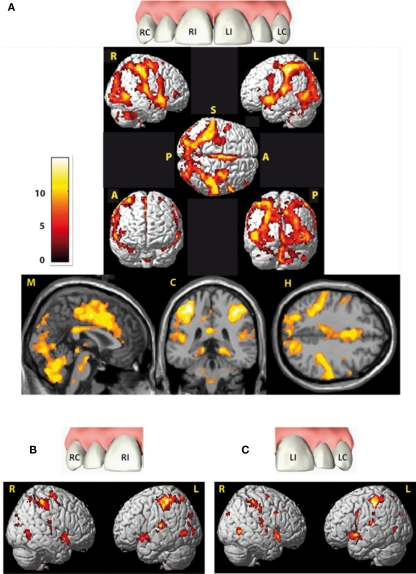
Figure 2.
Cortical areas activated by electric tooth stimulation across all four teeth (A) and with respect to both right teeth (RI and RC) and both left teeth (LI and LC) respectively (B,C). Activity is projected onto the single-subject-MNI-template. Indicators at the rendered brains stand for the views: R, from right; L, from left; S, from superior; A, from anterior; P, from posterior, all brain figures are in neurological orientation. Slices from left to right: midsagittal (M), coronal (C) at Y = −36 and horizontal (H) at Z = 54. Data are corrected for multiple comparison (FWE) p = 0.01 with an extended threshold of 10 voxels.

