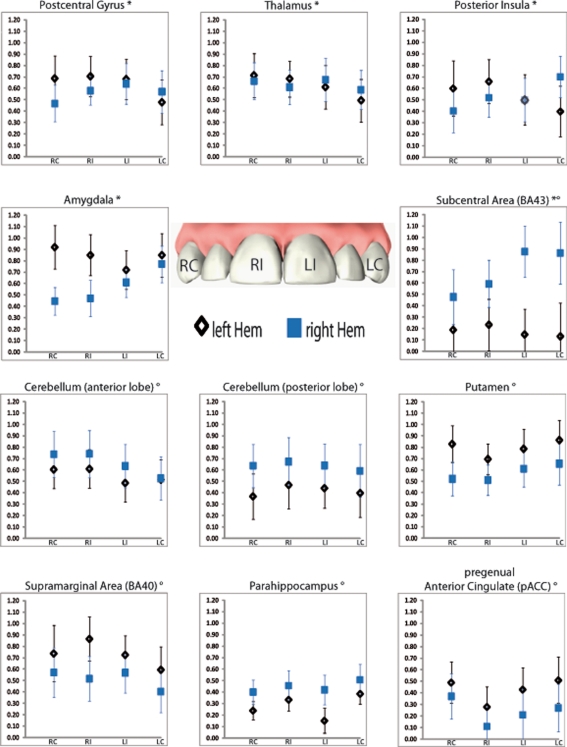
Figure 3.
Regions of interest (ROIs) showing significant main effect hemisphere (indexed with °) or interaction (indexed with *) in the repeated measure ANOVA. Displayed are mean activations (Y axis) with corresponded standard errors for each tooth within the respective hemisphere. RC, right canine; RI, right central incisor; LI, left central incisor; LC, left canine.

