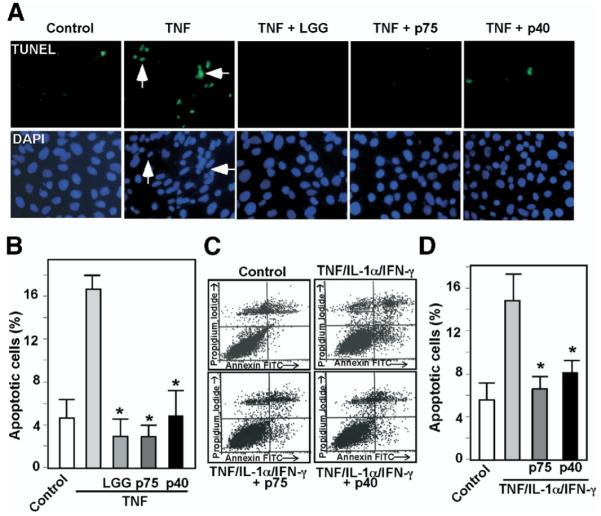
Figure 3.

p75 and p40 Inhibit cytokine-induced apoptosis in intestinal epithelial cells. KSRI−/− MCE cells (A and B) or HT29 cells (C and D) were treated with TNF (100 ng/mL) for 6 hours or the “cytokine cocktail” combination of TNF (100 ng/mL), IL-1-α (10 ng/mL), and IFN-γ (100 ng/mL) for 16 hours, respectively, in the presence or absence of 1-hour pretreatment with viable LGG, p75 (100 ng/mL), or p40 (10 ng/mL). LGG, p75, and p40 were maintained during the entire course of cytokine treatment in all experiments shown in this paper. KSR−/− MCE cells were fixed for TUNEL with apoptotic nuclei labeled with FITC and DAPI staining (A). FITC and DAPI labeled images were taken from the same field. Arrows indicate representative apoptotic nuclei. The percentage of cells undergoing apoptosis is shown (B). HT29 cells were dissociated and stained with Annxin V-FITC and propidium iodide and analyzed by flow cytometry (C). Results are shown as density plots with Annxin V-FITC vs propidium iodide (D). Viable cells have low Annexin V-FITC and low propidium iodide staining (lower left quadrant); early apoptotic cells have high Annexin V-FITC and low propidium iodide staining (lower right quadrant); late apoptotic cells have high Annexin V-FITC and high propidium iodide staining (upper right quadrant); and necrotic cells have low Annexin V-FITC and high propidium iodide staining (upper left quadrant). The early apoptotic cell populations in the lower right quadrant are shown in D. *P < .01 compared with TNF (B) or the “cytokine cocktail” (D), respectively. Experiments were performed on at least 3 separate occasions.
