
Figure 3.
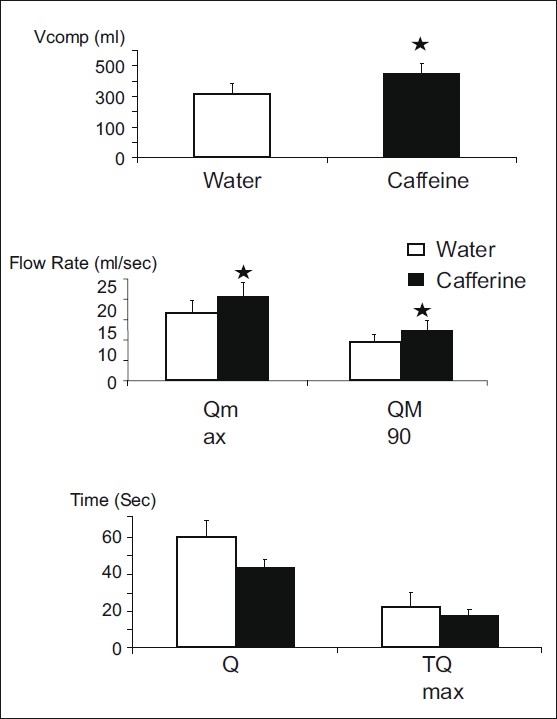
Uroflowmetric parameters (mean±SE) after water and caffeine ingestions (Q 100=flow time, TQmax=time to max flow rate, Qmax =maximal flow rate, QM90=average flow rate, Vcomp=voided volume); *P≤0.05 on comparing the values after water and caffeine ingestions