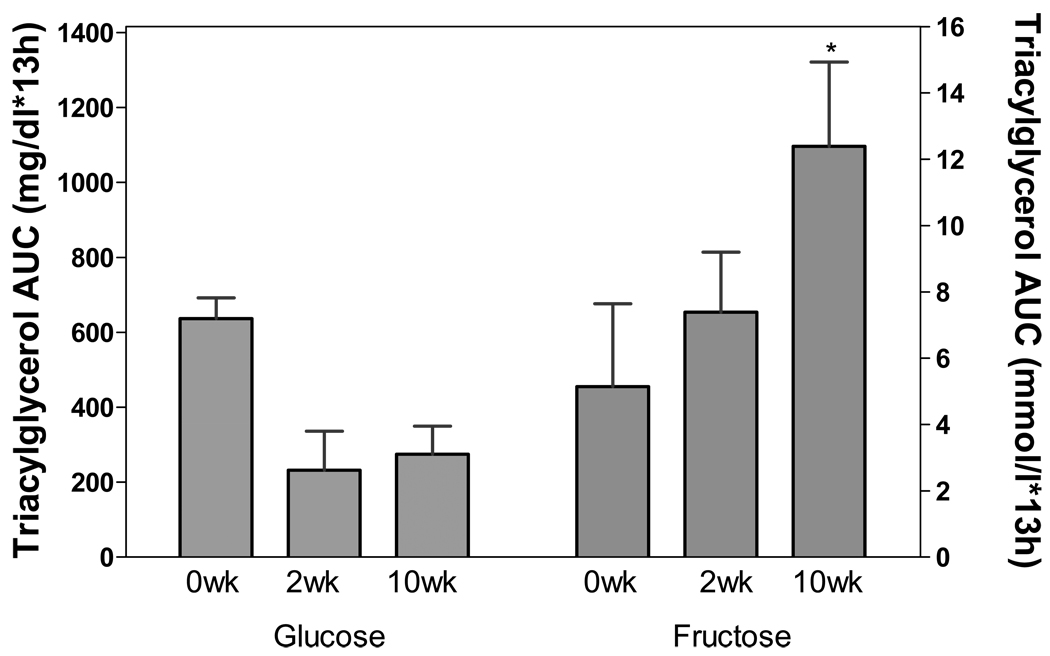
Figure 2.
14-h area under the curve (AUC) for plasma TG at baseline and at 2 and 10 weeks of dietary intervention in women consuming 25% of energy as glucose-sweetened beverages (n=3) or fructose-sweetened beverages (n=5). Comparison of fructose and glucose response analyzed by two-factor repeated measures ANOVA using GraphPad Prism (version 4.03; San Diego, CA) with Bonferroni posttests. Sugar×Time interaction: P = 0.017; *P < 0.05 vs 10 wk glucose. Data are mean ± SEM.

