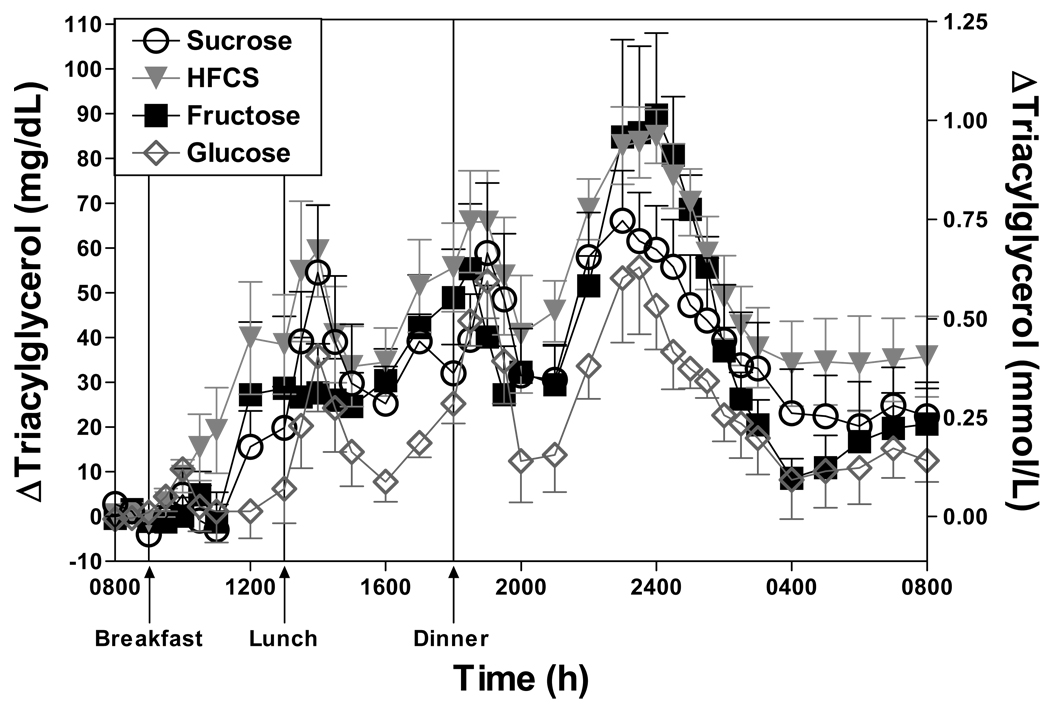
Figure 3.
Change of plasma TG concentrations from mean baseline levels (0800–0900 h) during four separate 24-h periods (0800–0800 h) in 7 men consuming HFCS-, sucrose-, fructose- and glucose-sweetened beverages at 25% of calculated energy requirements with each meal. Baseline TG concentrations were not different on the four study days. The effects of the 4 sugars on 24-h TG AUC were significantly different (p=0.007: repeated measures one-factor ANOVA) and the 24-h AUC during HFCS was significantly higher than during glucose consumption (p<0.01, Tukey’s post-test). Data are mean ± SEM.

