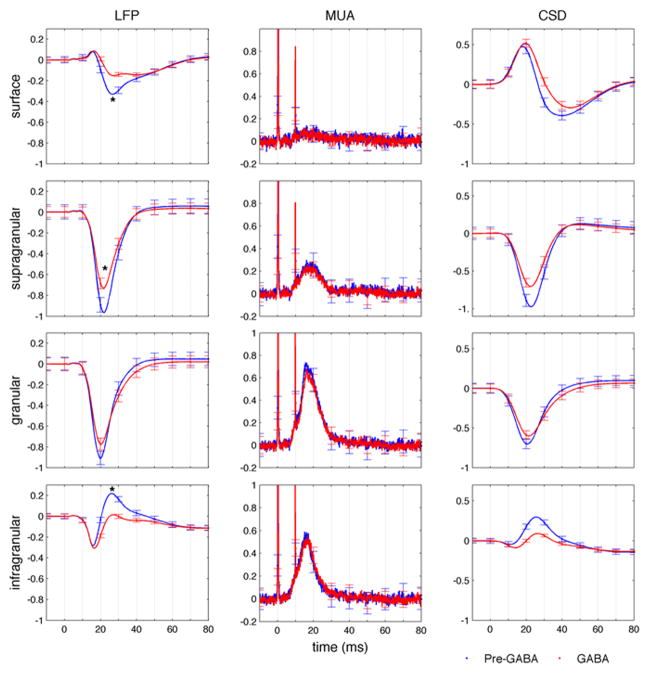
Fig. 2.
Average responses across the cortical column measured with a laminar electrode. Local field potential (left), multi-unit activity (middle) and current source density profiles (right) are obtained averaging across rats the electrodes on the surface (0–100 um depth, top panel), in superficial layers (200–400 um depth, supragranular), in the middle layer (600–900 um depth, granular), and in the bottom layers (1300–1600 um depth, infragranular). Blue traces correspond to pre-GABA responses and red traces to responses after GABA application. Error bars represent standard errors. Stimulation occurred at t=0 ms. * in the LFP graphs indicate statistically significant change (p-value<0.05) on the peak amplitude between the pre-GABA and GABA conditions.

