
Figure 3.
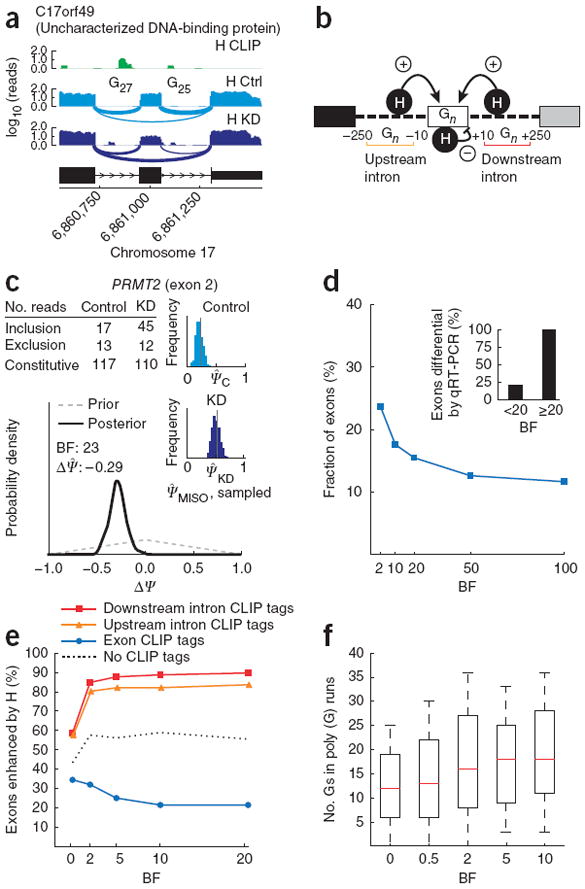
Bayes factor analysis of hnRNP H regulation of exon splicing. (a) CLIP tag density (H CLIP; green) and RNA-seq read densities in hnRNP H–knockdown and control conditions (H KD and H Ctrl; light and dark blue, respectively) for an alternative exon in human C17orf49. Number of guanines in poly(G) runs in upstream and downstream introns is shown. (b) Model of hnRNP H function in splicing regulation: binding of poly(G) runs (Gn) adjacent to an exon enhances the exon’s splicing (+ arrows); binding in exon body represses splicing (− arrow). A 250-nt window in flanking introns was used to count CLIP tags in analyses. (c) BF for exon 2 of PRMT2 gene. Gray dashed line, distribution over ΔΨ under the null hypothesis; black solid line, posterior distribution. (d) Cumulative distribution of BFs using hnRNP H RNA-seq data for exons with sufficiently high read coverage. Inset, fraction of differentially regulated exons (ΔΨ ≥ 0.15 by qRT-PCR), grouping exons by BF (n = 25 exons). (e) Percentage of exons enhanced by hnRNP H (ΔΨ > 0), plotted against increasing BF thresholds, for exons with CLIP tags in downstream or upstream introns but not in exon body (red and orange curves), for exons with CLIP tags in exon body but not in flanking introns (blue curve) and for exons with no CLIP tags (dotted black line). (f) Guanines in poly(G) runs in downstream intron, plotted against increasing BFs.