
Figure 5.
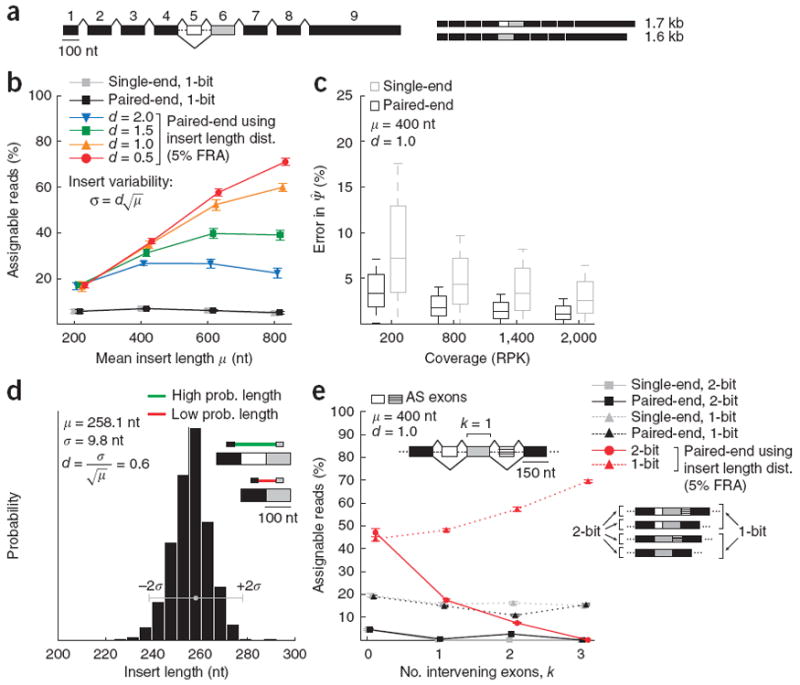
Improved estimation of isoform abundance using paired-end reads. (a) Representative gene model with 100-nt first exon, 100-nt skipped exon (exon 5, in white), 150-nt constitutive exons and 600-nt last exon. (b) We simulated reads from the two-isoform gene model shown in a while varying the mean, μ, of the insert length distribution, setting the s.d. to adjust for the higher variability expected in the size selection for longer fragments. Fraction of 1-bit (assignable to only one isoform) paired and single-end reads is plotted (±s.d.). (c) Distribution of errors for paired-end and single-end estimation as coverage increases (measured in RPK). (d) Histogram shows library insert length distribution computed from read pairs mapped to long constitutive 3′ UTRs in a human testes RNA-seq data set. In the example exon trio shown (similar to that in Fig. 1d), the insert length distribution assigns a higher probability to the top (inclusion) isoform than to the bottom (exclusion) isoform, for which the inferred insert length is improbably small. (e) Fraction of assignable 2-bit and 1-bit reads (±s.d.) for paired-end and single-end reads as a function of the number of intervening constitutive exons, k.