FIGURE 6.

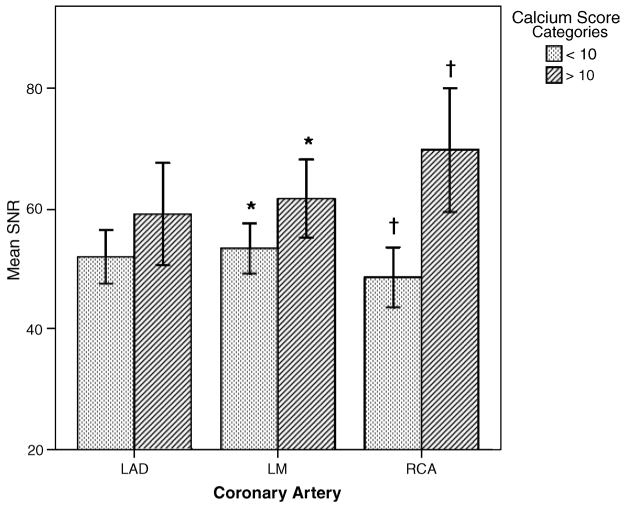
The relationship between SNR and image quality category for each coronary artery stratified by Agatston calcium score. Differences were significant for the LM and RCA (*P = 0.032, †P = 0.001). T bars represent 95% confidence interval.

The relationship between SNR and image quality category for each coronary artery stratified by Agatston calcium score. Differences were significant for the LM and RCA (*P = 0.032, †P = 0.001). T bars represent 95% confidence interval.