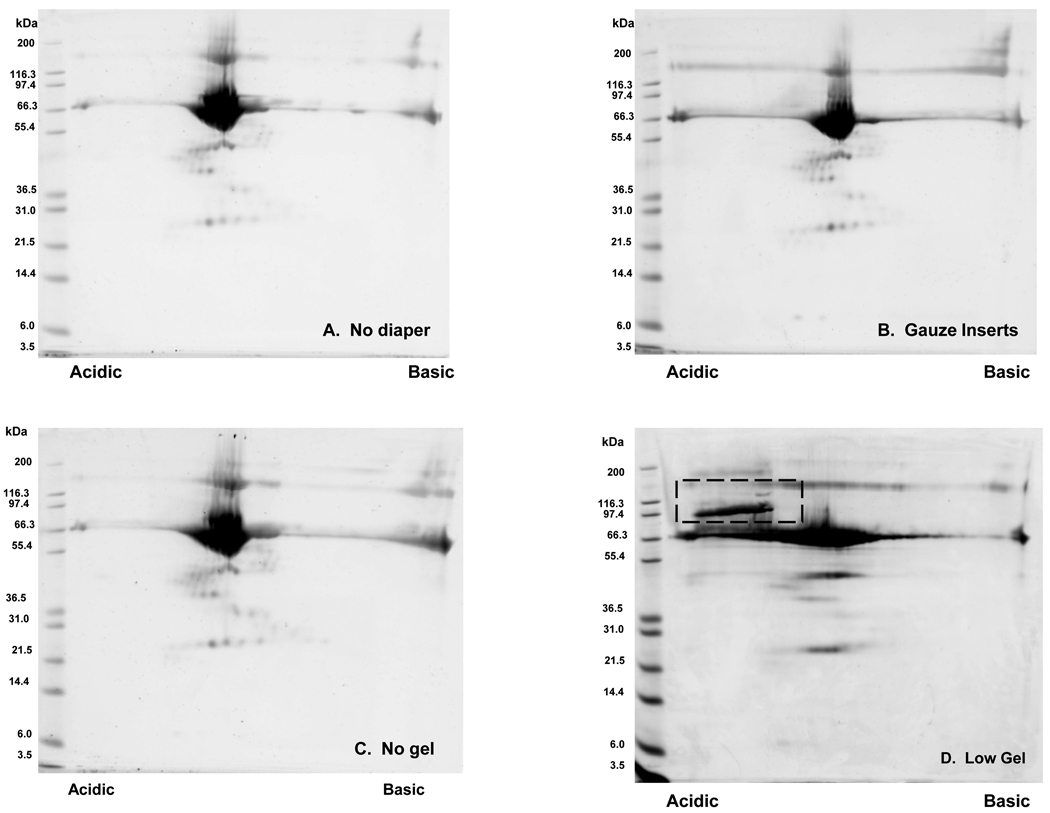
Figure 7.
Comparison of 2D gel images obtained using buffered water samples obtained pre- and post-extraction from various diaper matrices. BSA (0.3 mg/mL) was added to all samples prior to extraction as a positive control. Representative gel images from samples obtained (A) pre-extraction and post-extraction from (B) gauze insert, (C) non-gel and (D) low-gel diapers are presented. Qualitative expression patterns observed in gels from samples obtained post-extraction from non-gel and gauze insert diapers appear comparable (on visual inspection) to those achieved with non-extracted samples. For samples extracted from a low-gel containing matrix, however, there is an area of intensity in the upper left corner of the image that is not present images from the other collection methods. This area is denoted with a dashed, rectangular box on the gel image.

