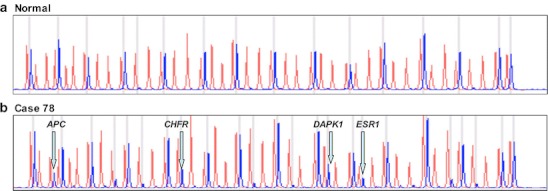
Fig. 1.

a A normal control DNA sample generates 41 individual peaks for all probes in the absence of HhaI (red) and 15 separate peaks in the presence of HhaI (blue). b Aberrant methylation identified in tumor sample as the appearance of a signal peak that is otherwise absent in normal DNA samples, seen here for APC, CHFR, DAPK1, and ESR1
