Figure 3.

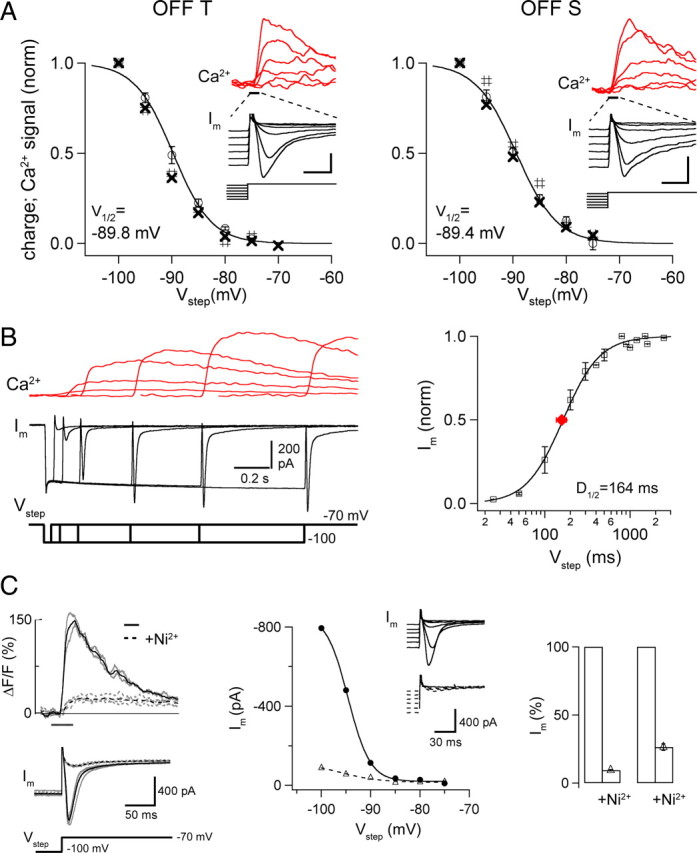
Properties of rebound-evoked inward currents and Ca2+ signals in OFF cells. A, Graphs plot (open circles) normalized area of the inward current (charge) evoked by voltage steps to −70 mV from different amplitude prepotentials; group data (OFF-T, n = 7, left; OFF-S, n = 5 cells). Separate symbols show area of current (#) and Ca2+ signal (X) from individual cells in insets; scale bars, 200 pA/30% ΔF/F, 0.2 s (OFF-T); 200 pA/80% ΔF/F, 0.2 s (OFF-S). Note the close correspondence between currents and Ca2+ signals. V half values are from Boltzmann fits to average data (see Materials and Methods) with k (slope factor): 3.60 ± 0.31 OFF-T; 3.83 ± 0.40 OFF-S. B, Simultaneously recorded whole-cell currents and proximal Ca2+ signals from an OFF-T cell following a voltage step from V hold = −70 to −100 mV for varying lengths of time. Ca2+ indicator in this experiment was 250 μm Fluo-5F. Right side panel shows normalized current versus step duration for 3 OFF-T cells. Current increased with duration of deinactivating step. The average time for half-deinactivation (D 1/2, red symbol) from fit of Hill equation (see Materials and Methods) was 164 ± 21 ms. C, Ca2+ signals (top, left side) and whole-cell currents (below) in an OFF-T cell in response to voltage step from −100 to −70 mV before (solid line) and after (dotted line) application of 100 μm NiCl2. Means of 2–4 sweeps (black) show that Ni2+ reduced currents and Ca2+ signals similarly. Middle, Peak current versus V hold in control (solid line) and Ni2+ (dotted line) for the same OFF-T cell. Insets show individual current sweeps in response to voltage steps from six negative prepotentials (between −75 and −100 mV) to −70 mV. Right, Bar graph showing the mean Ni2+-induced reduction of peak (left, 91 ± 1%) and area (right, 73 ± 2%) of rebound-evoked inward current in response to a voltage step from −100 to −70 mV. All recordings made in the presence of synaptic blockers mixture (see Materials and Methods) and 0.1 μm TTX.
