
Figure 7.
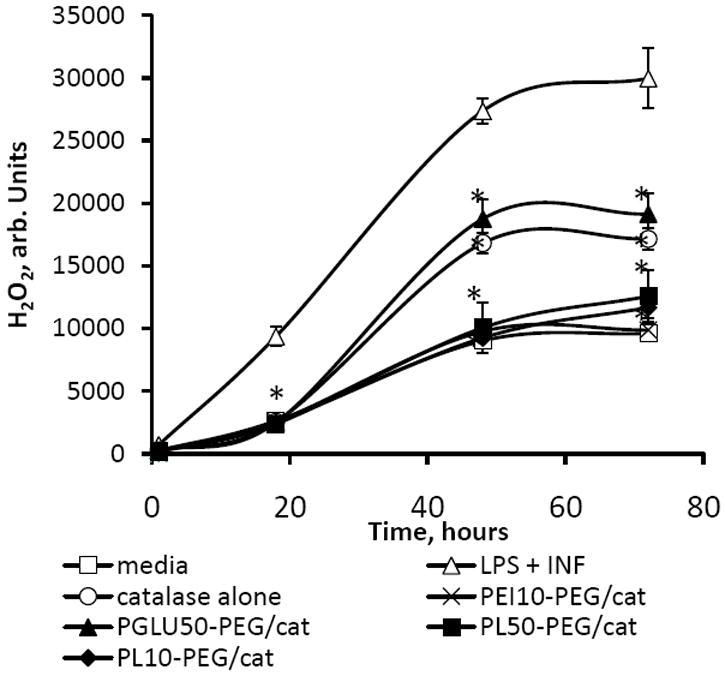
Modulation of BMM-derived ROS by catalase nanozymes (Z = 1). BMM were stimulated with LPS (20 ng/ml) and γ-INF 2 (μg/ml) for 24 hours, and then the media was supplemented with: catalase alone (empty circles); PL50-PEG/catalase (filled squares); PL10-PEG/catalase (filled diamonds); PEI50-PEG (crosses); PGLU50-PEG/catalase (filled triangles); fresh media (empty triangles). Control non-activated BMM were incubated with fresh media (empty squares). Then cell media was supplemented with Amplex Red Dye stock solution (10 U/mL HRP, 10 mM Ampex Red) for 30 minute, and the amount of H2O2 produced by BMM and decomposed by catalase nanozymes was measured by fluorescence at λex=563 nm, λem=587 nm. The maximal activity of nanozymes was observed for BIC obtained with positively-charged block copolymers. Data represent means ± SEM (N = 8). Statistical significance of the amount of H2O2 decomposed by nanozyme or catalase, compared to activated microglia is shown by asterisks: (*) p<0.05, (**) p<0.005.