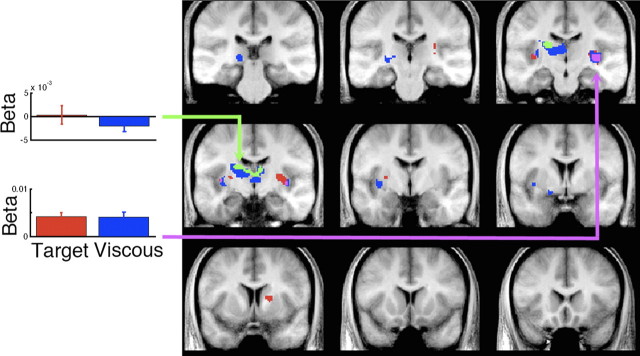
Figure 4.
Correlation of trial-by-trial movement amplitude and BOLD activity in basal ganglia. Significant positive correlations with amplitude at the group level, corrected for multiple test comparisons (FDR, p < 0.05) are shown in red for the viscous trials, blue for the target trials, and purple for their overlap. Significant task differences where the correlation with amplitude was stronger for target than viscous challenge task are shown in green. Left, Mean beta ± SEM for the entire population corresponding to the magnitude of the parameter correlating amplitude and BOLD for the left caudate (MNI: −14, −12, 22) and right putamen/insula (MNI: 34, −20, 0). Coronal sections are −30, −23, −16, −11, −4, 2, 9, 13, and 20 mm relative to anterior commissure.

