
Fig. 14.
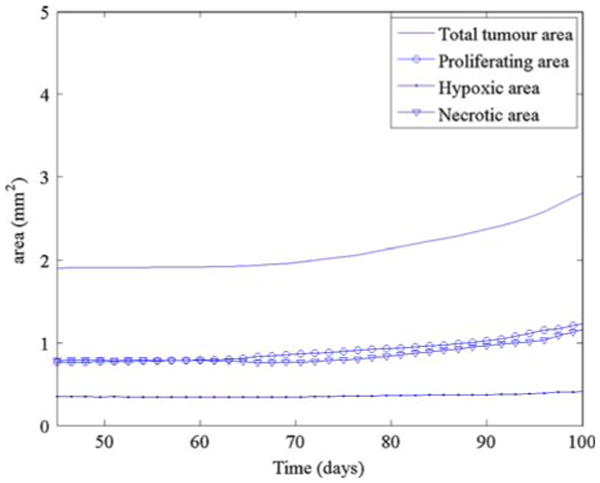
The areas (mm2) of the total tumour (solid line), proliferating region (open circle), hypoxic region (solid dot) and the necrotic region (inverted triangle) as a function of time for the simulation in Fig. 12
Official websites use .gov
A
.gov website belongs to an official
government organization in the United States.
Secure .gov websites use HTTPS
A lock (
) or https:// means you've safely
connected to the .gov website. Share sensitive
information only on official, secure websites.
The areas (mm2) of the total tumour (solid line), proliferating region (open circle), hypoxic region (solid dot) and the necrotic region (inverted triangle) as a function of time for the simulation in Fig. 12