
Fig. 15.
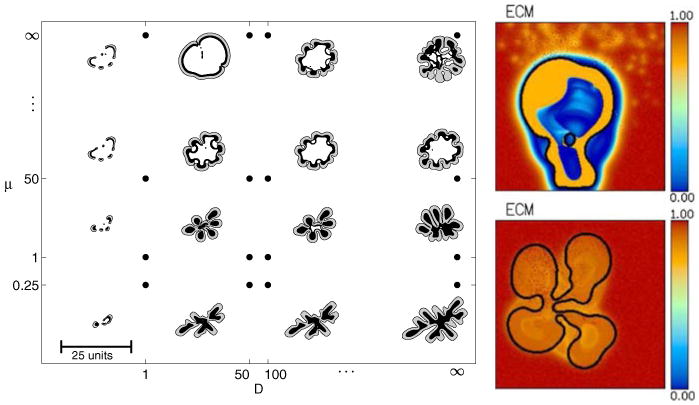
Left predicted tumour morphological response to microenvironmental nutrient availability (increases along horizontal axis) and biomechanical responsiveness (increases along vertical axis) from [47] (reprinted with permission from Elsevier). Right Tumour morphology and ECM profile at 150 days with enhanced matrix degradation (top, Sect. 4.5) and lower matrix degradation (bottom, Sect. 4.3)