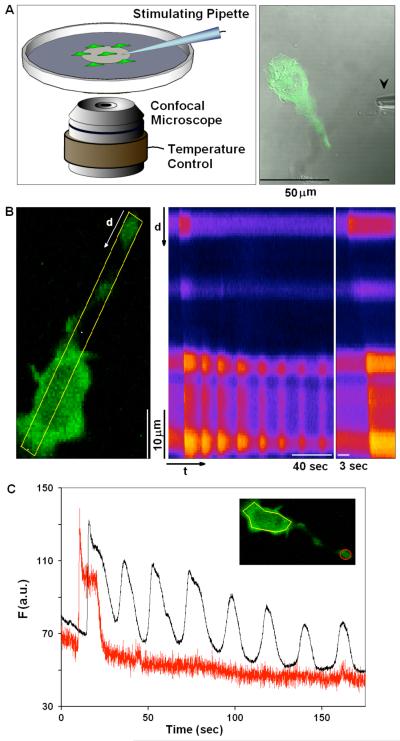
Figure 1. Visualization of Ca2+ dynamics in individual RBL mast cells.
A) Cells were plated at low density on MatTek dishes, and individual cells were stimulated using a pulled capillary (arrow; 0.5-1 μm diameter), filled with stimulating solution (as specified for each experiment) that was puffed at the cell (5psi/10sec pulse) from a distance within 100 μm. B) Image of RBL cell expressing GCaMP2 and sensitized with anti-DNP IgE, stimulated with a puff of 1.7 μg/ml Ag (DNP-BSA). Middle panel shows time line analysis of the stimulated cell and changes in Ca2+ concentration occurring over time in the 7 pixel wide line segment defined in the left panel. Changes in Ca2+ concentration are indicated by relative changes in brightness, where brighter colors represent higher Ca2+ concentration. Right panel expands early time points of the time line analysis and highlights our general observation that Ca2+ elevation initiates in cellular protrusions and propagates through the cell body. C) Traces of GCaMP2 intensity changes over time as calculated for the same cell imaged in B (inset). Black and red traces represent the changes in Ca2+ concentration in cell body (yellow ROI) or cell protrusion (red ROI), respectively.

