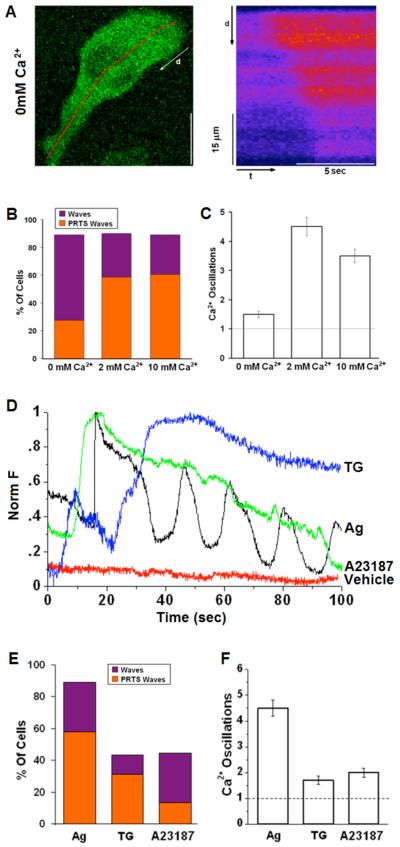
Figure 2. Dependence of stimulated Ca2+ waves and oscillations on extracellular Ca2+and stimulus.
A) Representative cell sensitized with IgE and stimulated with 1.7μg/ml Ag in the absence of extracellular Ca2+. Right panel shows time line analysis for early time points and indicated segment in left panel image. B) Histogram showing percentage of cells responding to stimulus with Ca2+ waves as averaged over multiple experiments for 0mM Ca2+ (n=29), 2mM Ca2+ (n=80); 10mM Ca2+ (n=28). Bar height shows total percentage of waves; orange portion represents the percentage of waves originating in protrusions (PRTS). C) Average number of oscillations within 2 min of stimulation under specified conditions. D) Representative traces of cells sensitized with anti-DNP IgE and stimulated with puff from pipette containing 1.7 μg/ml DNP-BSA (Ag), 1μM thapsigargin (TG), 20μM A23187 or BSS buffer only (vehicle). E) Percentage of cells responding to stimulus with Ca2+ waves averaged over multiple experiments and represented as in (B) with indicated conditions: Ag (n=80); TG (n=16); A23187 (n=29). F) Average number of oscillations within 2 min of stimulation under specified conditions. The first oscillation corresponds to the originating Ca2+ wave (dotted line). Error bars correspond to standard error of the mean (SEM).

