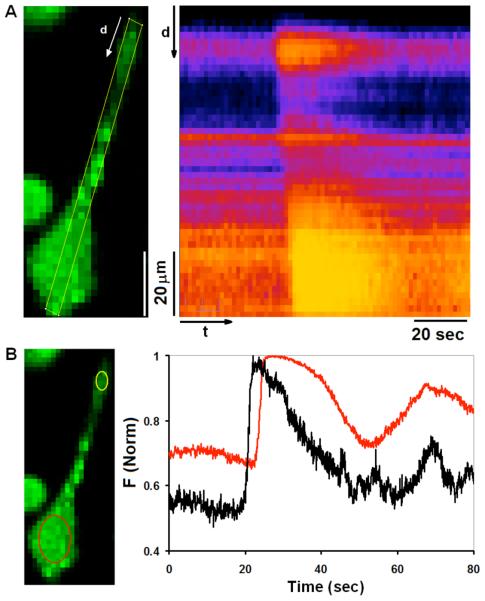
Figure 3. Ca2+ dynamics in individual rat BMMCs.
A) Confocal image of a representative rat BMMC sensitized with anti-DNP IgE and loaded with Fluo5F (left panel), and time line analysis of indicated ROI for this cell stimulated at t=0 with a puff of 1.7 μg/ml DNP-BSA (right panel). Changes in Ca2+ concentration in response to stimulation are depicted, where brighter colors represent higher Ca2+ concentration. Time line analysis highlights the Ca2+ elevation initiating in the tip of the cellular protrusion and propagating through the cell body. B) Traces of Fluo5F intensity changes over time as calculated for the same cell imaged in (A). Black and red traces in right panel represent changes in Ca2+ concentration in cell body (yellow ROI) and in cell protrusion (red ROI), respectively, in the left panel.

