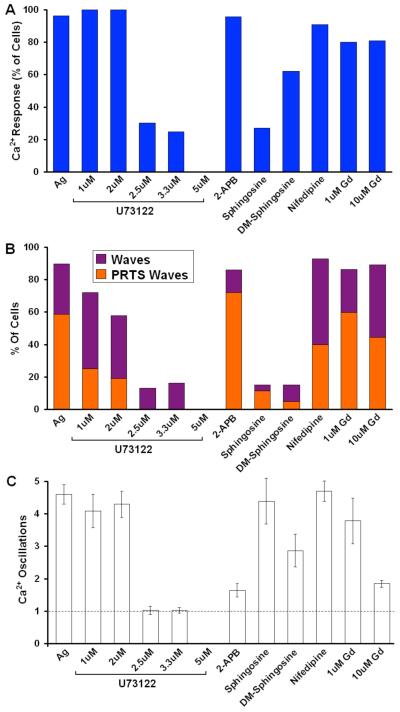
Figure 5. Effects of inhibitors on intracellular Ca2+ waves and oscillations.
A) Percentage of cells from multiple experiments showing a measurable Ca2+ response to stimulation by 1.7 μg/ml Ag in the presence of the following reagents in the extracellular buffer: 1-5 μM U73122 (n>18 each), 20mM 2-APB (n=23), 8μM D-sphingosine (n=26); 8μM DM-sphingosine (n=31), 10μM nifedipine (n=15), 1 or 10 μM GdCl3 (Gd3+; n>20 each) B) Percentage of cells responding to stimulus with Ca2+ waves as averaged over multiple experiments with indicated conditions. Bar height shows total % waves; orange portion represents % waves originating in protrusions. C) Average number of oscillations within 2 min of stimulation under specified conditions. The first oscillation corresponds to the originating Ca2+ wave (dotted line). Error bars correspond to SEM.

