
Figure 2.
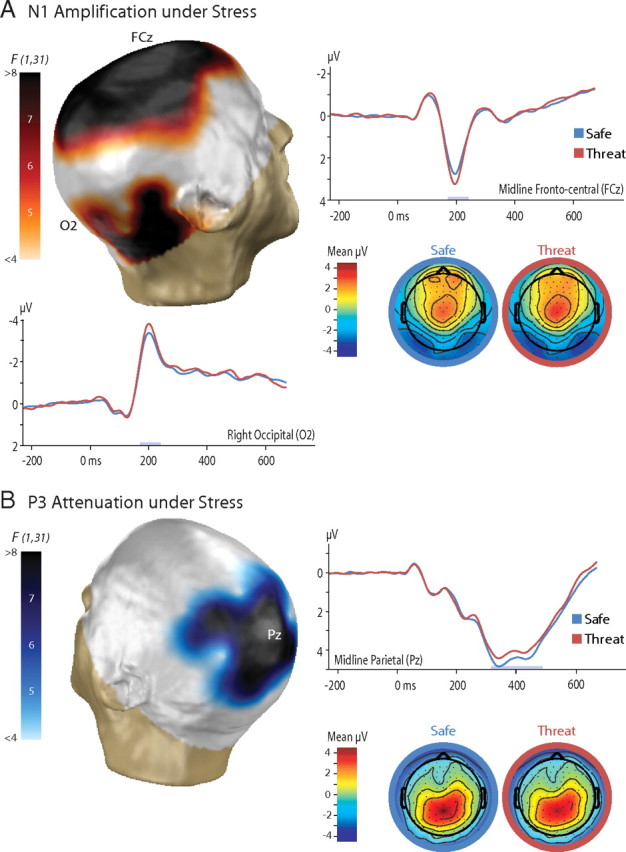
Stress amplified early perceptual processing (N1) and attenuated subsequent postperceptual processing (P3). The N1 and P3 components are shown in A and B, respectively. Three-dimensional topographic maps depict the thresholded threat versus safe contrast (uncorrected p < 0.05, corrected p < 0.10). Two-dimensional topographic maps depict the voltage for each condition. Results are shown for the average reference.