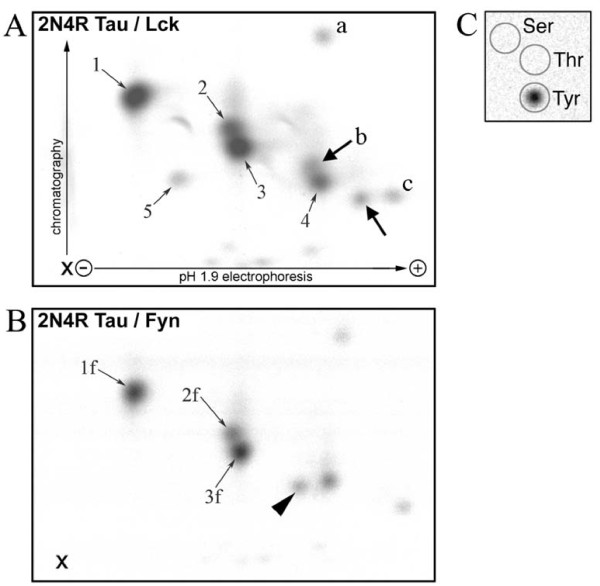
Figure 2.
2D Phosphopeptide mapping of tau phosphorylated by Lck or Fyn. The origin of the samples is marked (X). A, Map of 2N4R tau phosphorylated by Lck. B, Map of 2N4R tau phosphorylated by Fyn. Arrowhead and bold arrows indicate phosphopeptide spots apparently unique to tau phosphorylated by Fyn and by Lck respectively. Numbered spots contained phosphopeptides which were identified by mass spectrometry (see additional File 4: Table S3). Spots 1, 2, 3, 4, 1f, 2f, and 3f were identified by matching the peptide masses measured by MALDI-ToF MS with the theoretical masses of peptides. Also, peptides and phosphotyrosines in spots 1, 2, 3, 4, 5 and 3f were identified by direct sequencing by MS/MS. Peptides in spots a, b and c were not identified by mass spectrometry. C, Phosphoamino acid analysis: a representative phosphoamino acid analysis as performed on eight of the Lck-generated phosphopeptide spots, where the circles show the outlines of the ninhydrin-positive phosphoamino acid standards. Spots thus analysed included 1, 3, 4 and 5, and those labelled a, b and c in Figure 3A, and all were found to contain only phosphotyrosine; a further phosphotyrosine-containing spot ran above spot 1 and so is not seen in 2A.

