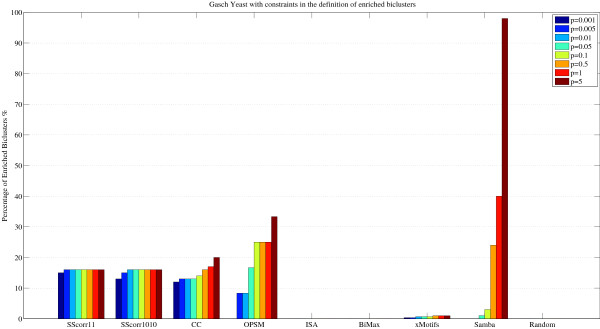
Figure 8.
Comparison of different Biclustering algorithms with hard definition of enrichment bicluster. Comparison of different Biclustering methods from GaschYeast data set with a restrictive definition of enriched biclusters: percentage of enriched biclusters by GO Biological Process category for each method at different significance levels (from p = 0.001% to p = 5%) by setting the allowed minimum number of genes per each GO category to 10 and the study fraction greater than 50%.

