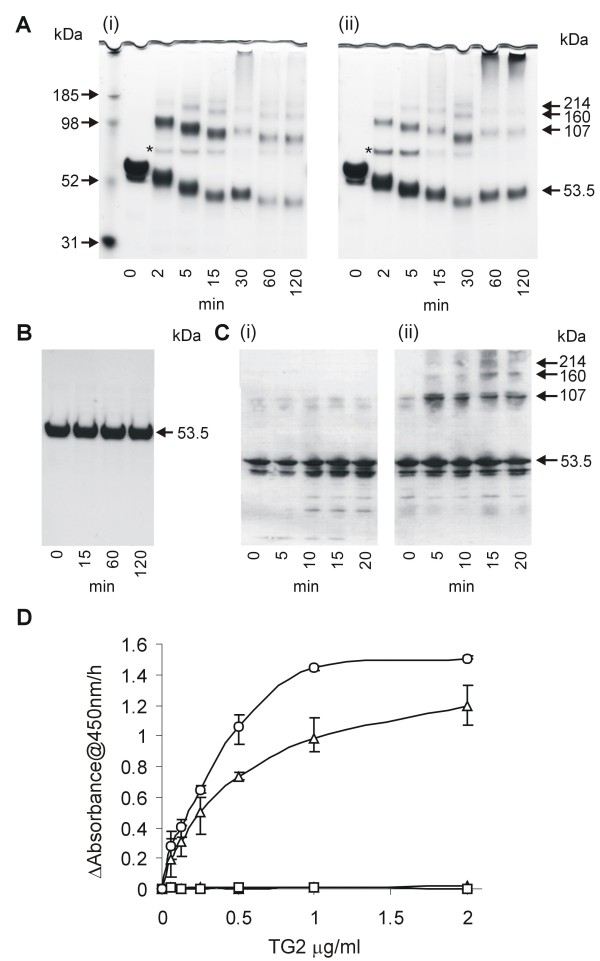
Figure 2.
Assessment of LSA-NRC cross-linking by TG2. A. SDS PAGE analysis of LSA-NRC samples after various times of incubation with 100 μg/ml of either gpTG2 (i) or hTG2 (ii). * indicates the band representing TG2 (MW - 76.6 kDa). B. SDS PAGE analysis of LSA-NRC samples after various times of incubation with 100 μg/ml of gpTG2 in the absence of CaCl2 indicating dependence of cross-linking on Ca+. C. Western analysis of LSA-NRC samples after incubation with lysates of human cell line SK-N-BE(2) (i) or its stably transfected derivative, TGA, that over-expresses hTG2 (ii). Blots were probed with anti-LSA-NRC polyclonal antibodies. D. Plate based colorimetric analysis of LSA-NRC TG2 mediated cross-linking. Change in absorbance at 405 nm is shown as a function of TG2 concentration. Open circles - hTG2; Open triangles - gpTG2; Open squares - gpTG2 in the absence of CaCl2; closed triangles - in the absence of TG2. Error bars show variation of 3 experiments.

