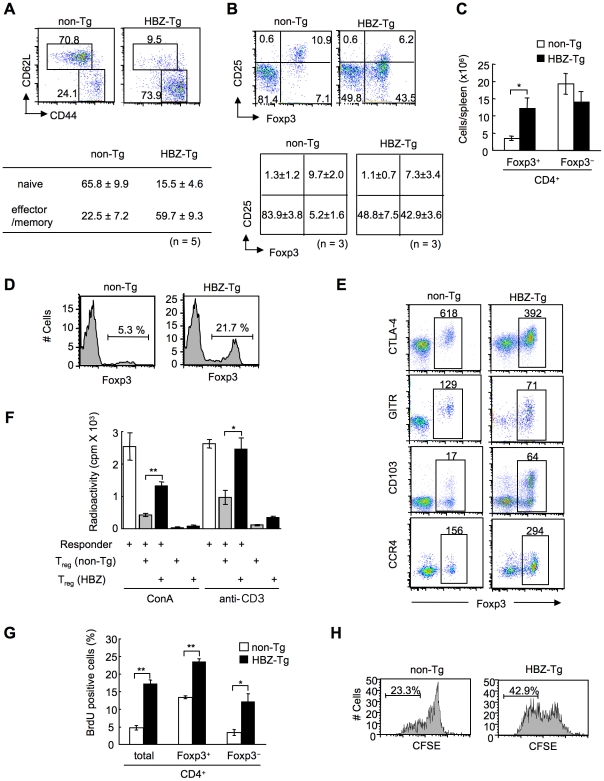
Figure 3. Transgenic expression of HBZ in CD4+ T cells increases Foxp3+ Treg cells with impaired suppressive function.
(A and B) Mouse splenocytes were stained with the indicated antibodies, and analyzed by flow cytometry. Representative dot plots gated on the CD4+ population are shown. For these experiments, HBZ-Tg mice without any symptoms were used. Tables show the mean ± SD (n = 5 for A, n = 3 for B). (C) The absolute number of Foxp3+ or Foxp3− CD4+ T cells in HBZ-Tg and non-Tg mice. The results shown are the mean ± SD (n = 3). (D) Flow cytometric analysis for the Foxp3 expression in CD4 single positive thymocytes. Representative dot plots gated on the CD4 single positive population are shown from three independent analyses. (E) Flow cytometric analyses of CD4+ T cells for Treg related molecules. Numbers in dot plots indicate mean fluorescence intensity (MFI) of each molecule in the rectangular gates. (F) Suppressive activity of Treg cells from HBZ- or non-Tg mice on T-cell proliferation. Sorted Foxp3+ T cells were cultured with CD4+CD25− cells of non-Tg mice as responder cells for 72 h with ConA or soluble anti-CD3 antibody and x-irradiated antigen presenting cells (APCs), and [3H] thymidine incorporation during the last 6 hours was measured. Results are means ± SD for triplicate cultures. (G) In vivo BrdU incorporation in total CD4+, Foxp3+CD4+, or Foxp3−CD4+ T cells. The results shown are the mean ± SD (n = 3). (H) Sorted Foxp3+ cells were labeled with CFSE and cultured with anti-CD3 antibody and x-irradiated APCs. After 96 hours, the cells were stained with anti-Foxp3, and CFSE dilution was analyzed for Foxp3+ cells. *, P<0.01; **, P<0.001 by two-tailed Student t-test.

