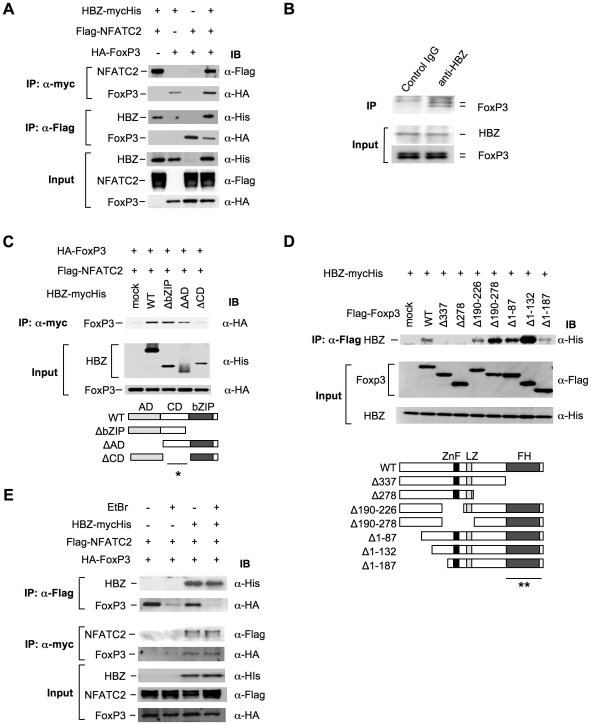
Figure 5. HBZ physically interacts with Foxp3 and NFAT.
(A) The expression vectors of the indicated proteins were co-transfected into 293FT cells, and their interactions were analyzed by immunoprecipitation (IP). (B) Nuclear extract of ATL-43T cells was subjected to IP with anti-HBZ antibody or control IgG, and detected by anti-FoxP3 antibody. (C and D) The interactions of HBZ and Foxp3 were analyzed by IP using HBZ mutants (C) or Foxp3 mutants (D). A schematic diagram of Foxp3 mutants is shown. ZnF, zinc finger; LZ, leucine zipper; FH, forkhead domain. Asterisks (* or **) show responsible region for each molecular interaction. (E) The interactions among HBZ, Foxp3 and NFATc2 were analyzed with or without EtBr.

