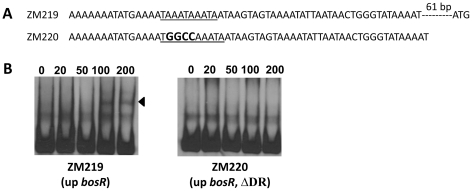
Figure 12. Analysis of the DR in the upstream region of bosR.
(A) Sequences of the probes used in EMSAs. The DR is underlined. Mutated nucleotides are indicated in boldface. (B) EMSAs. The concentration of BosR (nM) is designated above each lane. Probe name is indicated below the image. Bound DNA is denoted by arrows. The numbers in parenthesis indicate numbers of omitted nucleotides (dash lines) between the probe and the ATG start codon.

