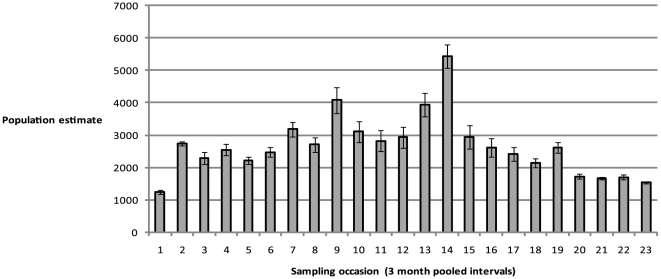
Figure 4. Temporal population estimates for total individuals (mature/sub-mature and immature individuals).
Estimates of total population for each pooled three-month sampling occasion from the time-dependent model from the capture matrix for all individuals, without sex distinction,  .Error bars (1 standard error of the mean) are shown. Mean population estimate over the entire sampling period is 2656 individual adult/sub-adult and immature Nautilus (95% CI = 844 to 4467; SD = 924).

