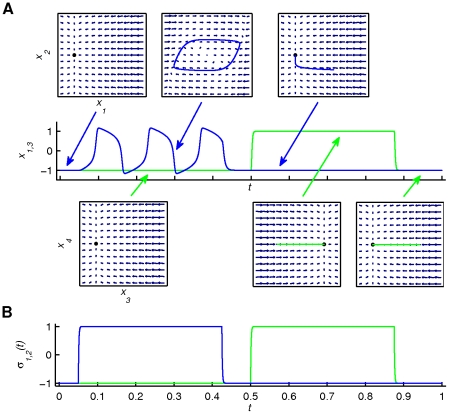
Figure 6. Illustration of Scenario 3.
Scenario 3 (see equation (5)) shows the temporal succession of the phase flows (linear fixed points and limit cycle) together with the corresponding concurrent segments of the output trajectories (panel A) as well as the output time series (positions x 1,3 in panel A and operational signals σ 1,2(t) in panel B). Colour coding and fixed point notation are the same as in the previous figures. The arrows are pointing at segments of the output time series during which a phase flow is activated (and thus dominates the output dynamics). The actual moment and duration of activation of each phase flow can be directly inferred by the operational signal plot in panel B. The phase flows change only at critical moments during the functional process due to the slow change of σ(t). Note that σ 1(t) and σ 2(t) operate upon the first and second finger phase flows respectively.

