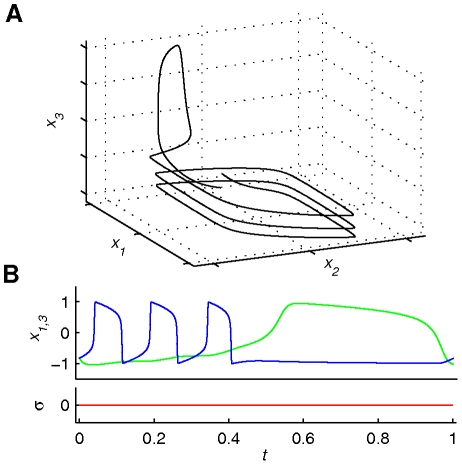
Figure 7. Illustration of Scenario 4.
Scenario 4 (see equation (6)) shows the phase flow (3-dimensional projection) through the output trajectory (panel A) as well as the output time series (positions x 1,3 and operational signal σ(t) –panel B). Blue and green discriminate between first and second finger (coupled) only for the time series plot. The phase flow remains constant during the functional process since there is no operational signal involved. Although this is just a 3-dimensional projection of the phase flow, one can observe the spiral of the three movement cycles of the first finger on the plane x 1−x 2, followed by one more on what would be the plane x 3−x 4.

