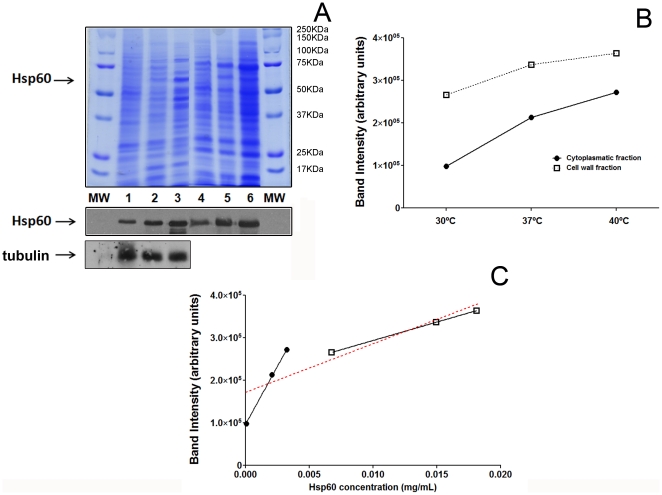
Figure 1. Analysis of Hsp60 levels in cellular fractions under distinct temperature conditions.
(A) SDS-PAGE displays the composition of proteins in the cytoplasm and cell wall of Hc under the different temperature conditions evaluated (upper panel). Notably, the levels of Hsp60 increase with temperature stress (immunoblot, lower panel). Lanes 1,2 and 3 are from cytoplasmic extracts obtained from cultures grown at 30, 37 and 37/40°C, respectively; 4, 5 and 6- cell wall preparations of yeast grown at 30, 37 and 37/40°C, respectively. MW represents the molecular marker. The samples were normalized as described in the methods. (B) Densitometry shows that Hsp60 levels increase with temperature stress in both cytoplasm and cell wall preparations. (C) Correlations of measured Hsp60 levels obtained by ELISA (Table 1) and immunoblot (p<0.05).

