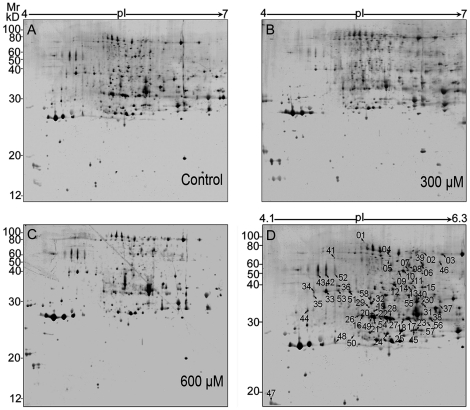
Figure 2. 2-DE image analysis of rice root apoplast proteome under H2O2 treatments.
(A–C) Set of three gels corresponding to apoplast protein samples treated with 0 (A), 300 (B), and 600 µM (C)of H2O2. (D) A representative gel showing the identified differentially expressed protein spots. 200 µg of the protein sample was loaded onto 24 cm IPG strips, pH 4–7 and electrophoresed as described in the text. The gel (12.5%) was stained using a mass spectrometry compatible silver staining method. A total of 58 protein spots were expressed differentially in response to the oxidative treatments, with p<0.05. Among these, 54 spots corresponding to 35 proteins are listed in Table S1.

