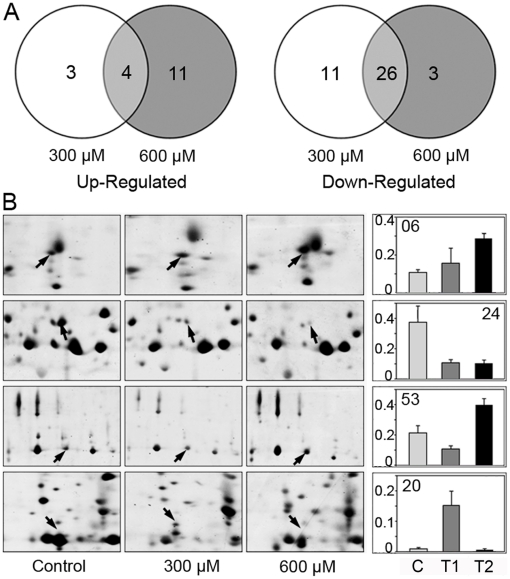
Figure 3. Change profile of the differentially expressed protein spots.
(A) Venn diagram analysis of the differentially expressed protein spots in the apoplast of rice seedling roots treated with 300 µM and 600 µM H2O2. The number of differentially expressed protein spots with up- (left panel) or down-regulation (right panel) under a given concentration of H2O2 are also shown. (B) Typical examples of spSots showing different profiles.

