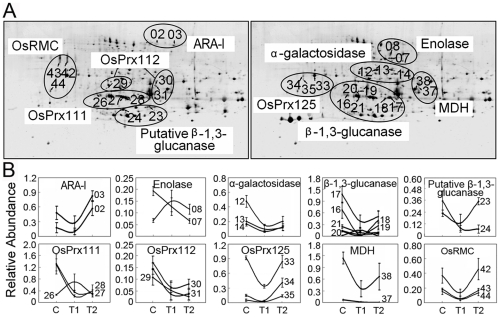
Figure 4. Close-up of possible isoforms detected by 2-DE (A) and their expression profile patterns (B).
All 29 differentially expressed protein spots, matching 10 different proteins, are shown. T1 and T2 represent H2O2 treatments of 300 µM and 600 µM, respectively. ARA-I, α-arabinofuranosidse/β-D-xylosidase isoenzyme; Prx, peroxidase; MDH, malate dehydrogenase; RMC, root meader curling.

