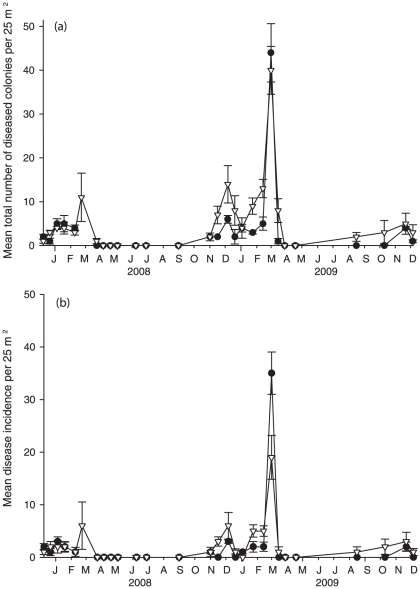
Figure 2. Mean number of diseased corals.
(a) Mean number of corals demonstrating signs of atramentous necrosis (AN) per 25 m2 during the two-year study. The highest numbers were found in February 2009 in Geoffrey Bay (GB). (b) Mean number of new infections (i.e. incidence) of AN per 25 m2 during the two-year survey. The highest numbers were found in February 2009 in GB. (GB = dark circles, NB = white triangles).

