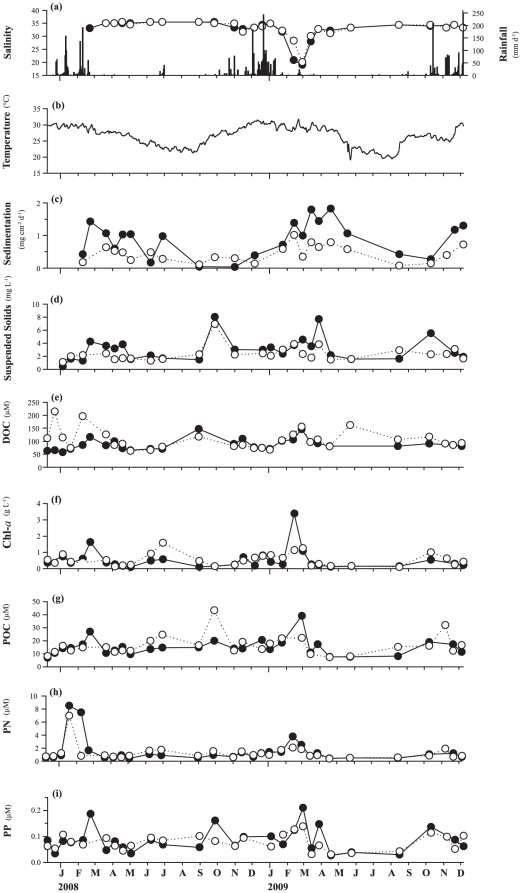
Figure 4. Temporal patterns in environmental variables.
Temporal patterns in (a) salinity and rainfall, (b) daily mean sea water temperature combining temperatures from both bays, (c) ash-free dry weight of sediment (AFDW), (d) suspended solids (SS), (e) dissolved organic carbon (DOC), (f) chlorophyll a (chl-a), (g) particulate organic carbon (POC), (h) particulate nitrogen (PN), and (i) particulate phosphorus (PP) during the two-year study in Nelly and Geoffrey Bays. Values represent means of two samples at each study site. (NB = dark circles, GB = white circles).

