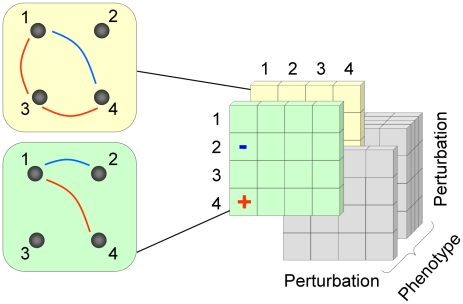
Figure 1. A schematic representation of the 3D epistatic map.
The 3D epistatic map is represented as a 3-dimensional entity (perturbation by perturbation by phenotype). Each “slice” of the 3D epistatic map represents an epistatic interaction network, created with respect to a single phenotype. Previous genome-scale studies of epistasis in yeast metabolism have focused on a single “slice”, whose interactions were computed with respect to the biomass production phenotype.

