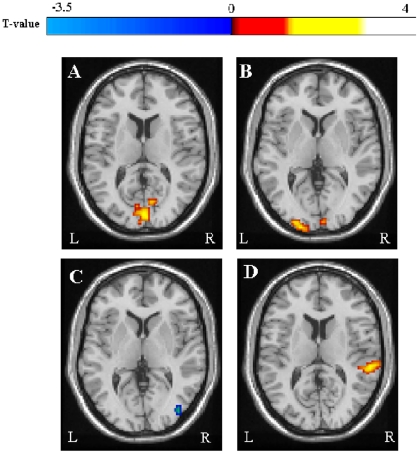
Figure 2. Spatial patterns of between-group differences in resting state (RS) fluctuations of the primary visual network (A, B), the secondary visual network (C) and the auditory network (D) between LHON patients and healthy controls.
Clusters of increased RS activity in LHON patients are color-coded with red to yellow T values, while clusters of decreased RS activity in LHON patients are color-coded with dark to light blue T values. Images are in neurologic convention.

